Survey research and design in psychology/Lectures/Descriptives & graphing
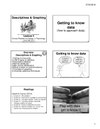
Lecture 03: Descriptives & graphing
| Resource type: this resource contains a lecture or lecture notes. |
This is the third lecture for the Survey research and design in psychology unit of study.
This page is complete for 2018. |

Outline
editOverviews descriptive statistics and graphical approaches to analysis of univariate data.
- Getting to know a data-set
- Parametric & non-parametric statistics & level of measurement
- Univariate descriptive statistics
- Univariate graphs
- Properties of the normal distribution
- Non-normal distributions
Readings
edit- Howitt and Cramer (2011a):
- Chapter 01 - Why you need statistics: Types of data (pp. 1-10)
- Chapter 02 - Describing variables: Tables and diagrams (pp. 11-22)
- Chapter 03 - Describing variables numerically: Averages, variation and spread (pp. 23-35)
- Chapter 04 - Shapes of distributions of scores (pp. 36-45)
- Chapter 05 - Standard deviation and z-scores: The standard unit of measurement in statistics (pp. 46-58)
- Howitt and Cramer (2014a):
- Chapter 01 - Why statistics? (pp. 1-16)
- Chapter 02 - Some basics: Variability and measurement (pp. 19-28)
- Chapter 03 - Describing variables: Tables and diagrams (pp. 29-43)
- Chapter 04 - Describing variables numerically: Averages, variation and spread (pp. 44-57)
- Chapter 05 - Shapes of distributions of scores (pp. 58-70)
- Chapter 06 - Standard deviation and z-scores: The standard unit of measurement in statistics (pp. 71-85)
Videos
edit- Video: Science is beautiful - explores 3 different visualisations, Florence Nightingale (health), genome overlaps, ocean currents (Nature Video, Youtube, 5:30 mins).
- Video: Is Pivot a turning point for the web? - demonstrates the potential for dynamic data visualisation in order to discover patterns and links (Gary Flake, TED talk - 6:25 mins).
Slides
edit- Lecture slides (Google Slides)
- 2018 handouts:
See also
edit- Survey design (Previous lecture)
- Correlation (Next lecture)
- Level of measurement
- Descriptive statistics
- Graphing
- Normal distribution
- Summary of univariate descriptive statistics and graphs for the four levels of measurement (pdf)
External links
edit- Practice quizzes
- Describing variables:Tables and diagrams quiz (Practice) (Howitt & Cramer, 2014)
- Describing variables numerically: Averages, variation and spread quiz (Practice) (Howitt & Cramer, 2014)
- Shapes and distributions of scores quiz (Practice) (Howitt & Cramer, 2014)
- Other