Skewness
Skewness refers to asymmetry (or "tapering") in the distribution of sample data:
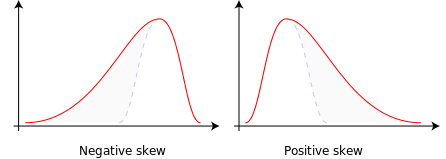
- negative skew: The left tail is longer; the mass of the distribution is concentrated on the right of the figure. It has a few relatively high values. The distribution is said to be left-skewed. In such a distribution, usually (but not always) the mean is lower than the median, and the median is lower than the mode; in which case the skewness is lower than zero.
- positive skew: The right tail is longer; the mass of the distribution is concentrated on the left of the figure. It has a few relatively low values. The distribution is said to be right-skewed. In such a distribution, usually (but not always) the mean is greater than the median, or equivalently, the mean is greater than the mode; in which case the skewness is greater than zero.
The relationship between mean and median is not sufficient to make a statement about the skewness of the distribution, but it can serve as an indicator[1].
In a skewed (unbalanced, lopsided) distribution, the mean is farther out in the long tail than is the median. If there is no skewness or the distribution is symmetric like the bell-shaped normal curve then the mean = median = mode. Usually there are three ways in which a set of data can be analyzed for its distribution: 1.By the range: This gives a rough idea of the spread of data but it is affected by extreme values. It is generally only used with small data groups together with either median or mode. 2.The interquartile range(IQR): It is not affected by extreme values and tells you how spread out the middle 50% of the observations are. The IQR is often used together with the median when data are skewed. 3.The mean with standard deviation: It is generally used when the data are symmetrical and the data size is not small.
