File:MATLAB surf sinc3D.svg

Size of this PNG preview of this SVG file: 512 × 384 pixels. Other resolutions: 320 × 240 pixels | 640 × 480 pixels | 1,024 × 768 pixels | 1,280 × 960 pixels | 2,560 × 1,920 pixels.
Original file (SVG file, nominally 512 × 384 pixels, file size: 1.31 MB)
| This is a file from the Wikimedia Commons. The description on its description page there is shown below.
Commons is a freely licensed media file repository. You can help. |
Summary
| Description |
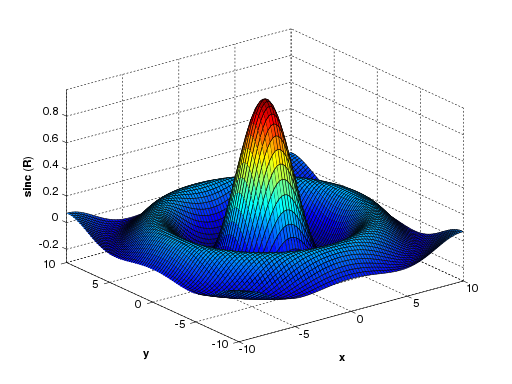
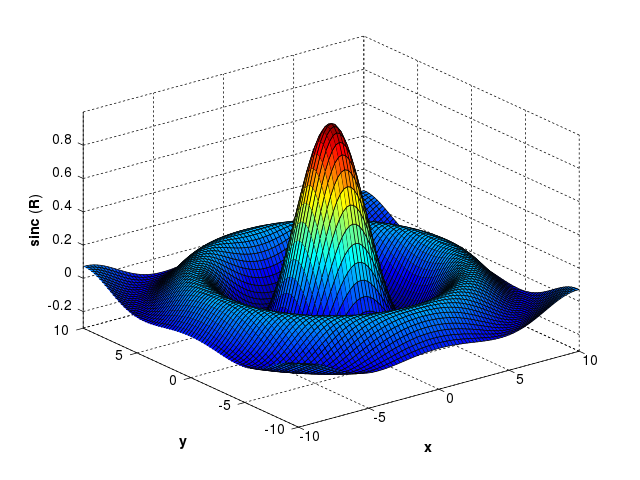
A three-dimensional surface plot of the unnormalized sinc function — precisely, |
| Date | |
| Source | Own work |
| Author | DmitTrix |
| Other versions |
|
| SVG development | |
| Source code | MATLAB code[X,Y] = meshgrid(-10:0.25:10,-10:0.25:10);
f = sinc(sqrt((X/pi).^2+(Y/pi).^2));
h = figure(1);
surf(X,Y,f);
axis([-10 10 -10 10 -0.3 1])
xlabel('{\bfx}')
ylabel('{\bfy}')
zlabel('{\bfsinc} ({\bfR})')
hidden off
plot2svg('sinc3D.svg',h) % utilizes the SVG exporting script (by Juerg Schwizer)
% available from MATLAB Central File Exchange
|


Licensing
| I, the copyright holder of this work, release this work into the public domain. This applies worldwide. In some countries this may not be legally possible; if so: I grant anyone the right to use this work for any purpose, without any conditions, unless such conditions are required by law. |
File history
Click on a date/time to view the file as it appeared at that time.
| Date/Time | Thumbnail | Dimensions | User | Comment | |
|---|---|---|---|---|---|
| current | 20:33, 24 May 2008 | | 512 × 384 (1.31 MB) | DmitTrix | {{Information |Description=A three-dimentional surface plot of the ''unnormalized'' '''sinc''' function — precisely, <math>\begin{align} & -10\le x\le 10 \\ & -10\le y\le 10 \\ & z=\operatorname{sinc}\left( \sqrt{x^ |
File usage
The following 2 pages use this file:
Global file usage
The following other wikis use this file:
- Usage on bg.wikipedia.org
- Usage on en.wikipedia.org
- Usage on es.wikipedia.org
- Usage on et.wikipedia.org
- Usage on fa.wikibooks.org
- Usage on hu.wikipedia.org
- Usage on hy.wikipedia.org
- Usage on ko.wikipedia.org
- Usage on mk.wikipedia.org
- Usage on mr.wikipedia.org
- Usage on my.wikipedia.org
- Usage on ta.wikipedia.org
- Usage on tr.wikipedia.org
- Usage on uk.wikipedia.org
- Usage on uz.wikipedia.org